How UPS battery end of life is defined, and why it should be measured
UPS batteries are sized with an aging factor, but internal resistance grows at a different rate than capacity fades. How the sizing works, and what to check in operation.
- Published
- Updated
- 6 min read
- 6 min read

When a data center loses utility power, the UPS battery carries the critical load until the generators start and pick it up. The design file gives that window as a few minutes. The battery is chosen to cover it in the last year of its life as well.
Will the battery still cover that window years from now? The designer answers by estimating end-of-life capacity with a fixed factor. Once the site is running, that estimate is rarely checked against a measurement.
How end of life and the aging factor are defined
A battery reaches end of life when the capacity it can deliver falls to a set share of its rated capacity. The common definition puts that share at 80%.
To cover the loss from day one, the designer oversizes the battery by an aging factor. With end of life at 80%, the factor is 1.25: 1.25 × 0.80 = 1.00. The new battery is sized at 125% of the requirement, so the 80% left at end of life still meets the full requirement.
The rest of the calculation follows the same pattern. The designer takes the critical load and the required runtime, then adds a temperature correction for cold rooms and a design margin. The manufacturer's constant-power discharge table then gives the number of modules that can deliver that power for that long.
The method is easy to apply and has been in use for decades. Its weak point is that it represents aging with a single number. Manufacturer tables usually describe a new battery. A curve showing how deliverable power changes with state of health (SOH) rarely makes it into the design file.
Why power sets the limit for a UPS battery
A UPS battery discharges at high power over a few minutes. In a discharge that short, the real question is whether the battery can hold the required power until the window closes.
A battery gives up less energy in a short, high-power discharge than it does in a long, low-power one. So a small loss of capacity can turn into a larger loss of runtime.
Internal resistance is the main reason. Under load, a cell's voltage drops by the current times its internal resistance. With example values: a cell with 0.5 mΩ of internal resistance drops 0.1 V at 200 A. If resistance rises to 1 mΩ, the drop at the same current is 0.2 V.
The UPS inverter draws roughly constant power from the battery. As voltage falls, current rises to hold that power, and the higher current deepens the drop. Cell voltage reaches its lower limit sooner, and the battery management system (BMS) ends the discharge. Some energy may still be left in the cells at that point, but the battery can no longer deliver it at the power required.
Aging does not move capacity and internal resistance at the same rate. A battery can keep most of its capacity while its internal resistance has risen markedly. A single aging factor does not separate the two.
What changes a battery's power capability at a given moment
The same battery delivers different power under different conditions. Design work mostly accounts for three factors.
State of charge (SOC). Cell voltage falls as charge falls, and in most chemistries internal resistance rises at low charge. In the last minute of an outage, the battery may deliver less power than in the first. If two outages come back to back and the battery cannot recharge in between, it starts the second one with less charge.
Temperature. A cold cell has higher internal resistance, so its voltage drops further at the same power. A hot cell ages faster. Temperature differences between racks in the battery room age the racks of the same battery at different rates over time.
Aging history. Cycle count, the charge level the battery is held at on standby and its operating temperature affect each string differently. Two identical installations commissioned on the same day can deliver different power a few years later.
How internal resistance affects the protection study
Internal resistance also sets the short-circuit current on the DC side. The fault current a string can supply is roughly its voltage divided by the sum of its cell and connection resistances.
A new battery has the lowest resistance and supplies the highest fault current. Breaker interrupting ratings and the arc-flash calculation are based on that case. An aged battery supplies less current. A protective device may then clear the fault more slowly, and a longer clearing time can mean more arc energy.
The protection study is usually run with a single resistance value from manufacturer data. With a measured resistance range, the study can be checked against real values for both the new and the aged battery.
Why the weakest cell matters
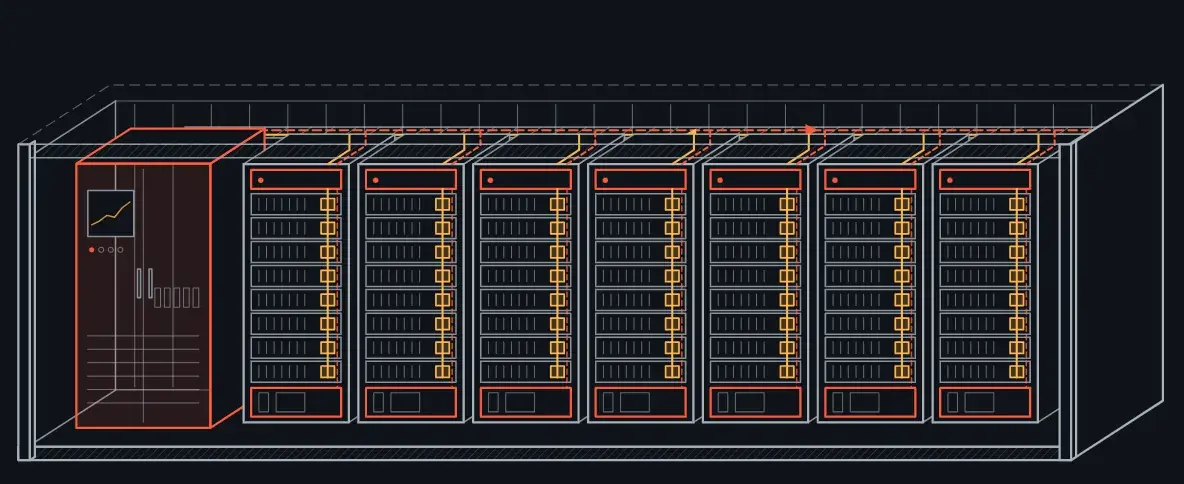
Cells in a string are in series, and the same current flows through all of them. During a discharge, the first cell to reach its lower voltage limit stops the whole string. That is why the weakest cell sets the power the string can deliver.
Between parallel strings, current divides in inverse proportion to resistance. A string whose internal resistance has grown takes a smaller share of the load. The other strings carry its share and age faster. If one string drops out, the rest take the whole load.
A single average health figure in a report hides these differences.
How to measure a battery's condition today
The most direct method is a capacity test. The battery is discharged at a set power down to its lower voltage limit, and the runtime is recorded. The result is reliable. During the test, though, the battery cannot fully do its backup job, and the result describes only the test day.
Cell-level measurement aims to answer the same question while the system runs. Electrochemical impedance spectroscopy (EIS) applies a small excitation to the cell across a range of frequencies and measures the response. Different parts of that response show internal resistance and the change in the cell's chemical state separately.
Tracked over time, these values show how each string's power capability changes with state of health. That curve helps answer three questions: at what power can the battery carry its design runtime today, how much do temperature and state of charge change that, and which string will set the limit first.
We explain how EIS works on our EIS page, and why usable capacity is not a fixed number in this post.
What to check in operation, and what to ask your vendor
- Ask for end-of-life discharge data. Alongside the new-battery tables, ask the manufacturer for constant-power discharge tables at end of life and at low temperature.
- Ask how internal resistance changes. Ask how internal resistance rises over life alongside capacity fade, and which of the two the end-of-life definition is based on.
- Record a baseline at commissioning. Record the resistance and discharge curve of every module, and of every cell where possible. Every later measurement is compared against it.
- Use routine tests as a data source. Transfer tests and generator tests put a short discharge on the battery. If you log cell voltages, current and temperatures during those tests, you can follow the resistance trend without an extra test.
- Report the weakest string separately. Track the lowest cell voltage and each string's values apart from the average.
- Update the protection study with measured resistance. At set intervals, recalculate interrupting duty and arc energy at both ends of the measured resistance range.
What Wattality is developing along this chain
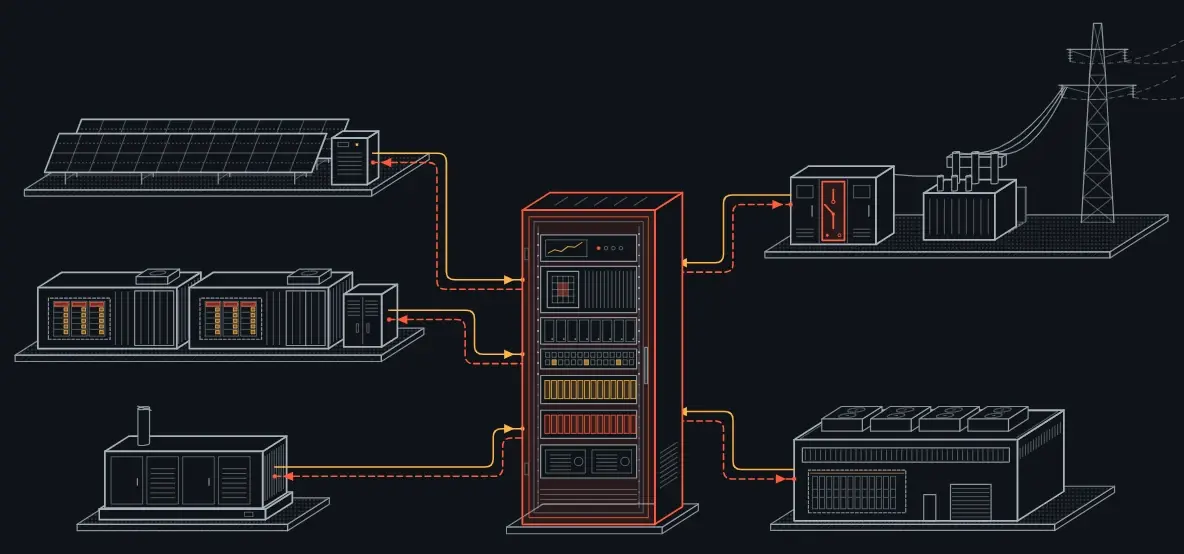
Wattality is developing an architecture that carries cell measurement into facility decisions.
- Sense is being developed to track internal resistance and chemical change at cell level while the system runs.
- Core is designed to turn that information into usable power and energy limits at pack, rack and container level.
- Site is designed to carry those limits into facility decisions, such as how long the battery can hold the load until the generator picks up.
- Fleet is designed to track aging trends across facilities and support replacement planning.
- UPS battery
- State of health
- Internal resistance
- Cell-level measurement
- Data center